Production Status

Striving to be

the Best in the Bakken

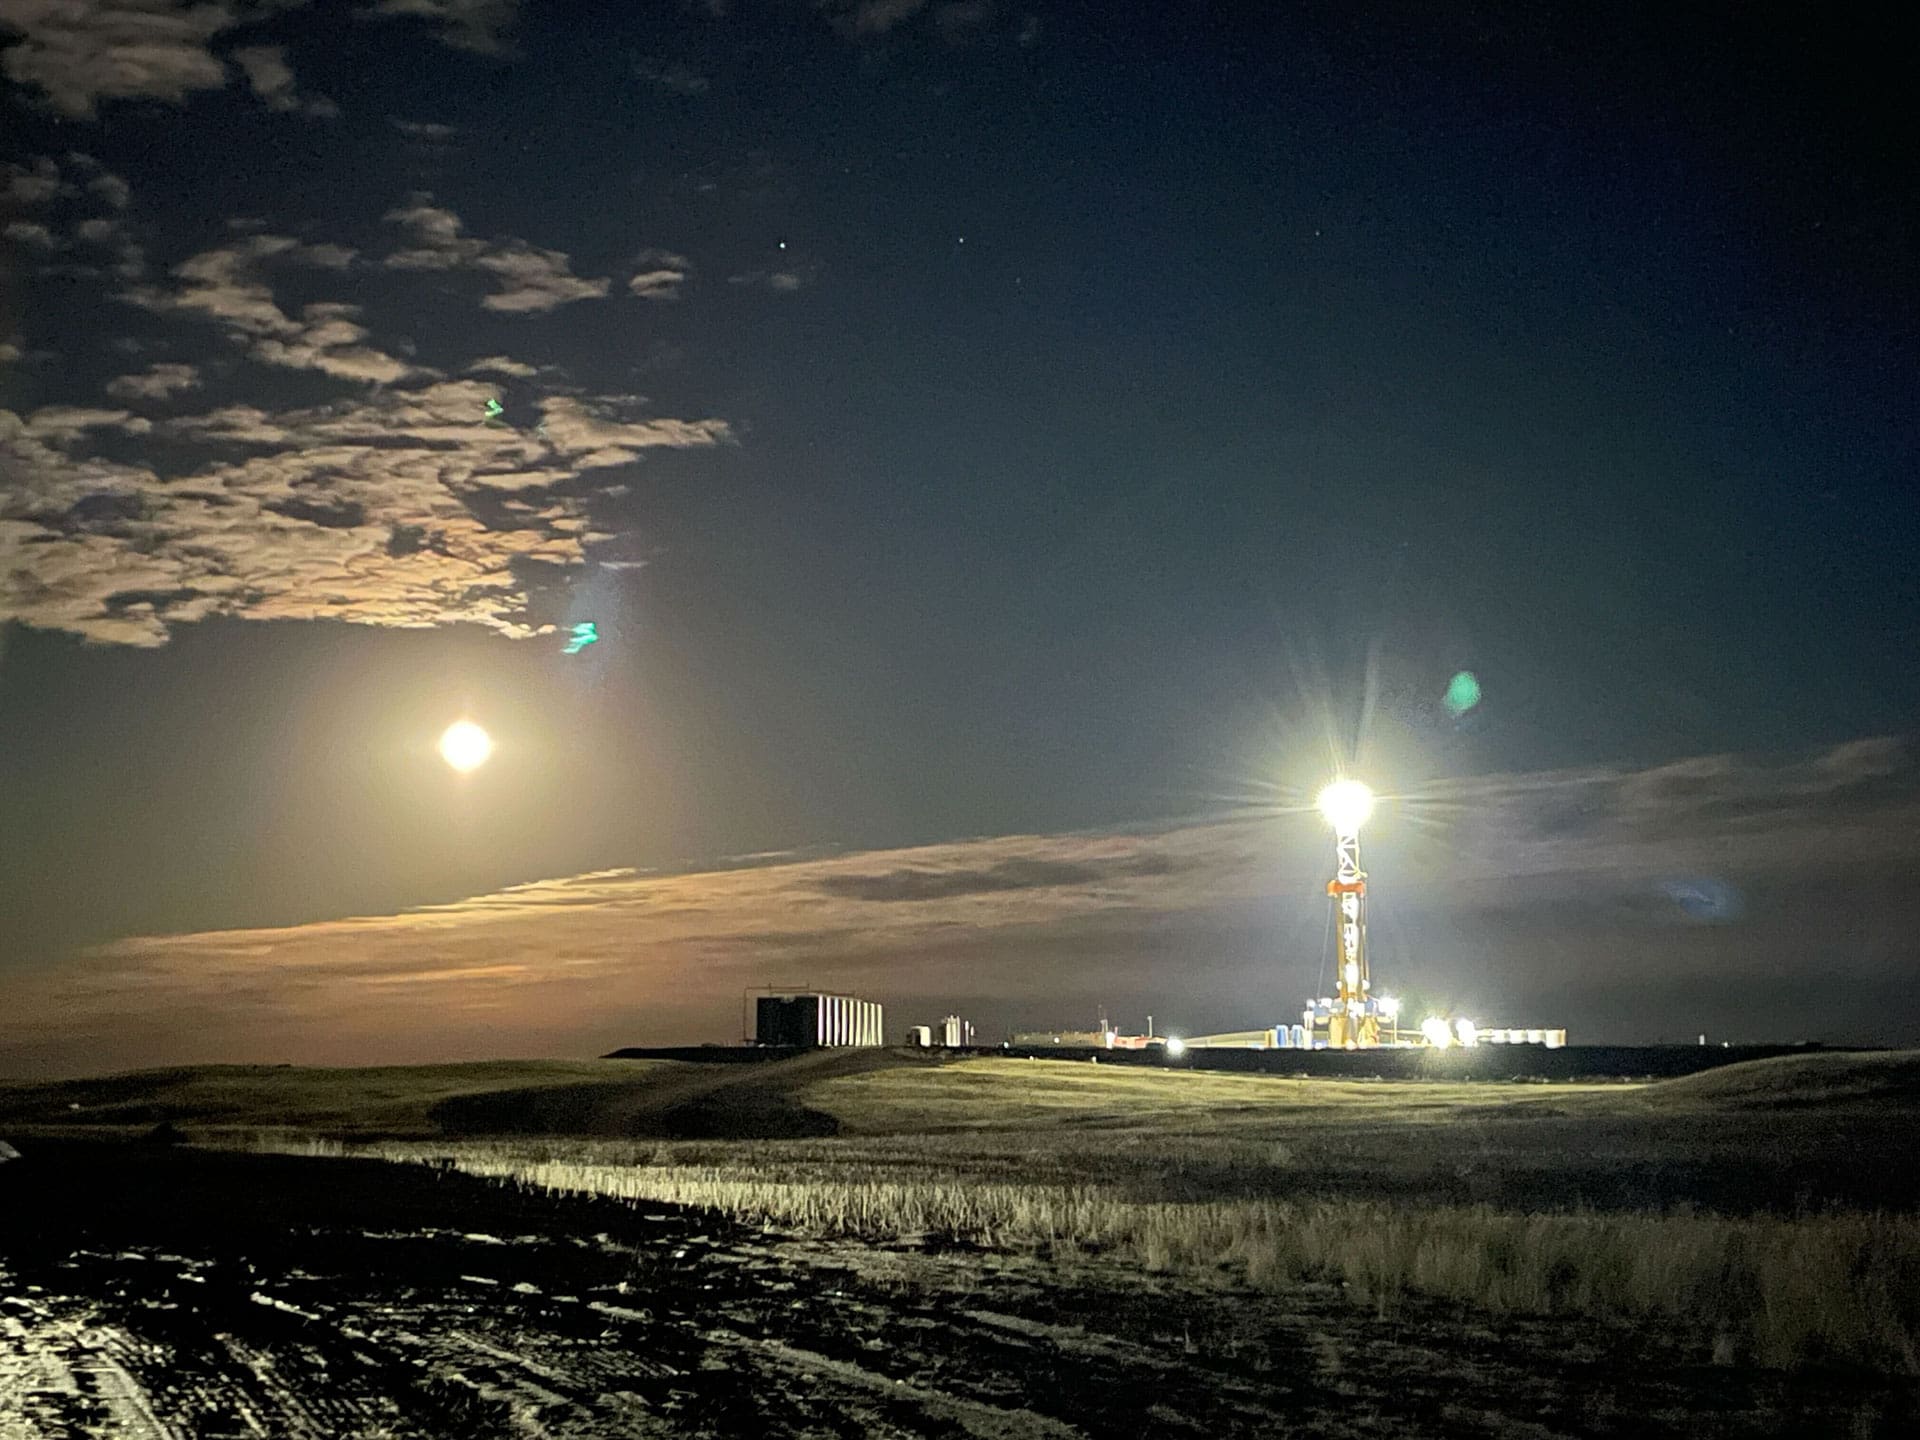
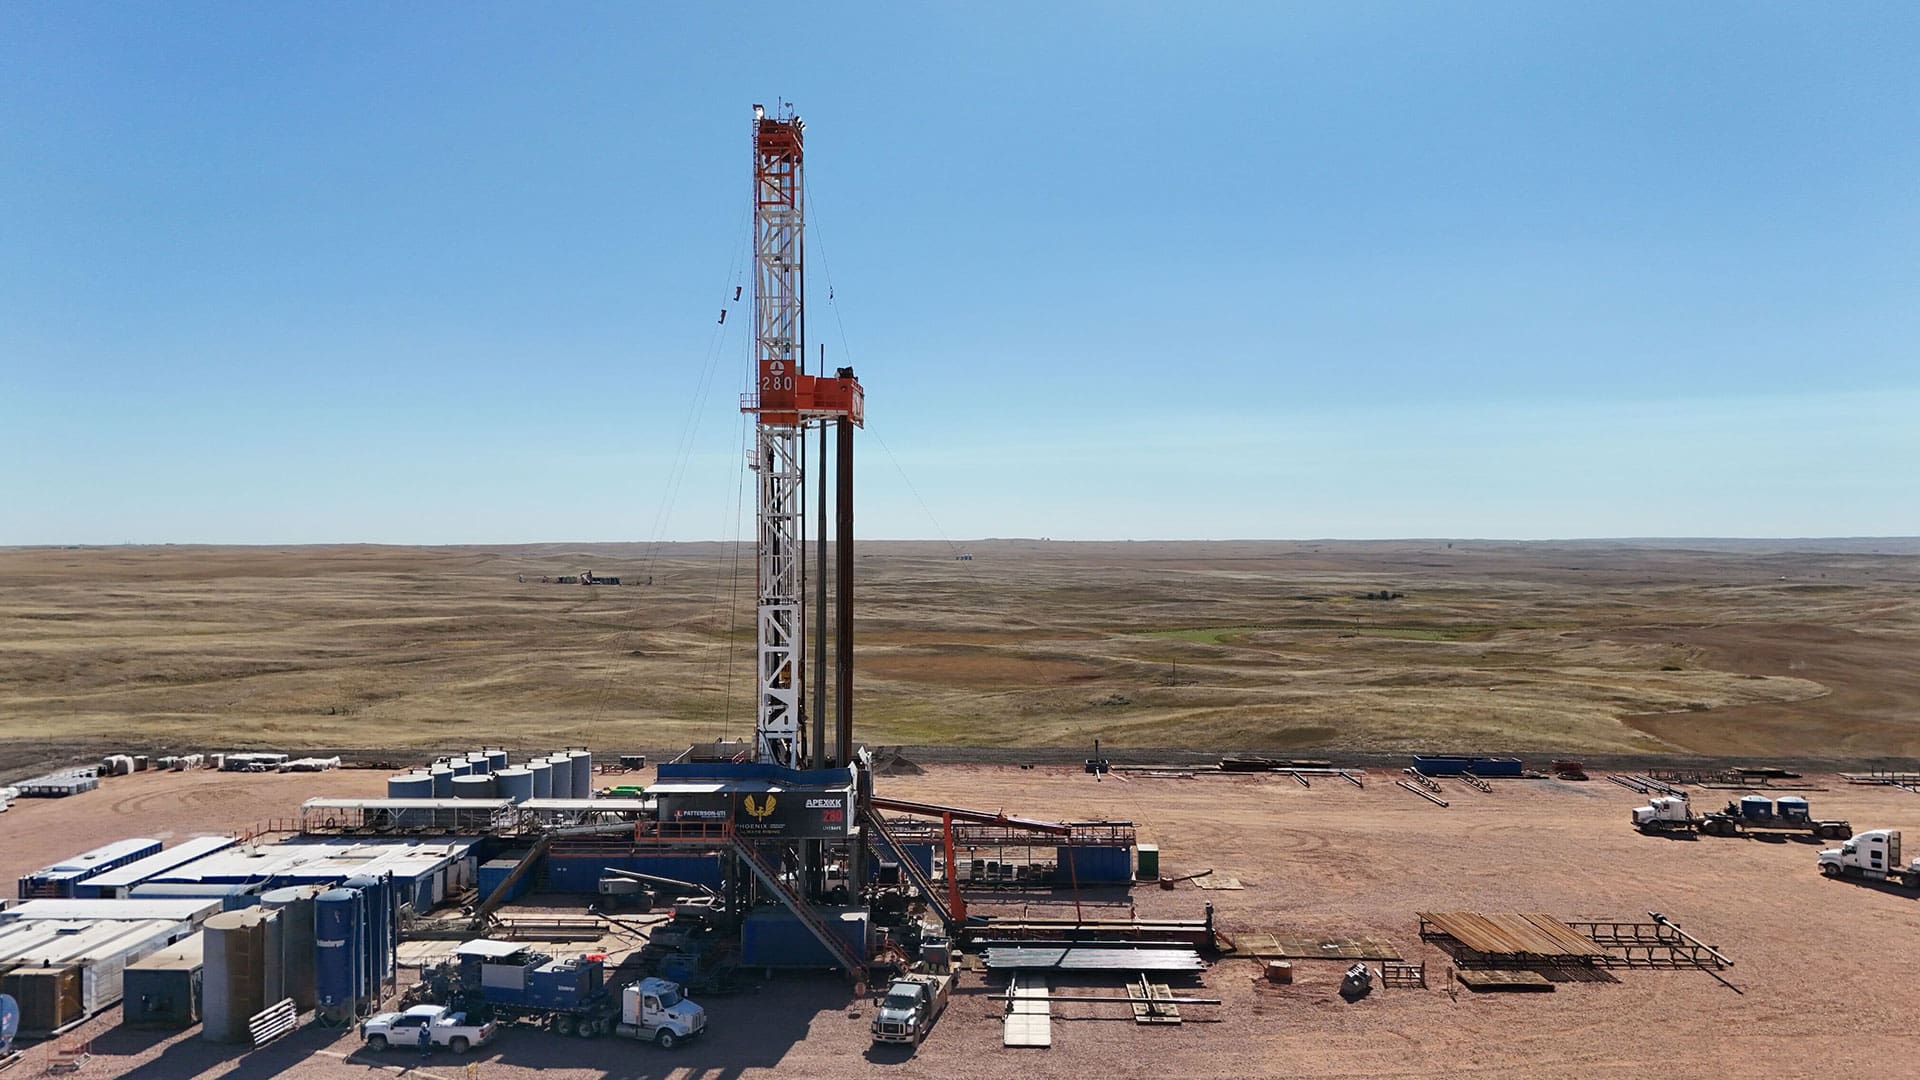
At Phoenix Energy, we’re redefining operational excellence in the Williston Basin. With record-breaking milestones and cutting-edge innovations, we’re proud to lead the charge in American energy independence.

January 1, 2024 - april 30, 2026

Daily Oil Production

Gross average barrels of oil per day as of 01/31/26 (by week). Oil production is only from wells owned and operated by Phoenix Operating, a wholly-owned subsidiary of Phoenix Energy. Phoenix’s portfolio of royalty assets and non-operated working interests are not included in this chart.

152

WELLS DRILLED

As of 4/30/26

96

WELLS PLANNED

Over the next 12 months

16.1M+

BARRELS OF OIL PRODUCED

As of 4/30/26

Drilling Performance in North Dakota & Montana

Rockin’ in the Bakken

PRODUCING

119

UNDER DEVELOPMENT

41

Well counts for producing and under development are as of 4/15/2026.

Longer Laterals = Enhanced Project Economics

Chasing Records IN THE BAKKEN

4 of the fastest 3-milers

DAYS TO TOTAL DEPTH¹

6.46

AXEL FERRARI 25-36-1 4H (Alamo)
6/29/2024

6.52

JACOBSON 19-30-31 3H (Alamo)
8/22/2024

6.52

DANIELE 26-35-2 2H (Alamo)
5/9/2024

6.60

AXEL FERRARI 25-36-1 5H (Alamo)
7/8/2024

one of the longest Laterals

ON A ONE-RUN 4-MILER

20.8K

lateral length (FT)²

NYSTUEN 20-17-8-5-1H (Alamo)
6/17/2025

4 of the fastest 4-milers

DAYS TO TOTAL DEPTH¹

9.29

WILLOW GRAY 2-11-14-23-4H (Alamo)
9/24/2025

9.71

WILLOW GRAY 2-11-14-23-2H (Alamo)
9/14/2025

9.77

WILLOW GRAY 2-11-14-23-5H (Alamo)
10/06/2025

10.38

NYSTUEN 20-17-8-5-4H (Alamo)
7/16/2025

  1. Days to total depth” (DTD or Days to TD) refers to the number of calendar days it takes to drill a well from the start of operations (spud date) to the point at which the well reaches its planned final depth
  2. Lateral length refers to the horizontal distance a wellbore extends within an oil or gas formation after drilling vertically to a targeted depth. Typical lateral lengths in modern unconventional drilling range from approximately 5,000 to 15,000 feet, enhancing reservoir contact and production efficiency.

Leveling up & Leveling Out

Hedging Against Risk

11.5M¹

Total Qty of Barrels Hedged
As of 11/11/25

x

$61.07

AVG PRICE PER BARREL
As of 11/11/25

=

$700M

hedged production revenue

1. As of 11/11/25, these positions have been fully placed. The derivatives contracts are comprised of approximately 94% swap contracts and 6% put contracts. The hedged value is the product of the number of outstanding contracts and the weighted-average price of the swaps and puts. Additional details are available on the SEC’s website in Phoenix Energy’s Form 10-Q: Quarterly report for quarter ending Sep 30, 2025. Note: “Hedging against risk” refers to swaps and options contracts purchased in the derivatives markets based on Phoenix Energy’s projected reserve assets as of 11/11/25. This hedging strategy covers approximately 75% of the value of the producing assets over a three-year period. It is important to note that hedging does not directly mitigate investor risk.

Leveling up & Leveling Out

Hedging Against Risk

12.66M¹

Total Qty of Barrels Hedged
As of 3/7/2026

x

$60.9

AVG PRICE PER BARREL
As of 3/7/2026

=

$770M

hedged production revenue

Current & Projected Hedged BArrels (MILLIONS)¹

1. As of 11/11/25, these positions have been fully placed. The derivatives contracts are comprised of approximately 94% swap contracts and 6% put contracts. The hedged value is the product of the number of outstanding contracts and the weighted-average price of the swaps and puts. Additional details are available on the SEC’s website in Phoenix Energy’s Form 10-Q: Quarterly report for quarter ending Sep 30, 2025. Note: “Hedging against risk” refers to swaps and options contracts purchased in the derivatives markets based on Phoenix Energy’s projected reserve assets as of 11/11/25. This hedging strategy covers approximately 75% of the value of the producing assets over a three-year period. It is important to note that hedging does not directly mitigate investor risk.

Drill Deeper Into
Phoenix Energy

Learn about our business, the oil & gas industry, and our bond offerings through an engaging 1-hour presentation.

Register For A Bond Webinar

By registering, you agree to the privacy policy and consent to receive automated SMS messages and/or email marketing about investment or relevant offers by or on behalf of Phoenix Energy and/or trusted affiliated companies at the phone number and email provided. Consent is not a condition of purchase. Opt-out at anytime.
OperationalPerformance
Feet Per Day
3.9K

Previous Record: 3.8K ft/day

Days to Total Depth
6.46+

Previous Record: 6.52 days

Redefining Efficiency in the Bakken

Operational Performance

Phoenix Operating’s drilling program, launched in September 2023, focuses on Williams and Divide Counties, North Dakota, using 3-mile Bakken laterals to enhance efficiency and reduce surface impact. In 2024, Phoenix set multiple Bakken speed records:

Exact depth is 3,898 ft/day. Feet/day and days to total depth include surface. Total depth of previous record held by Phoenix Operating Company on DANIELE 26-35-2 2H was 25,225′.

Drill Deeper Into
Phoenix Energy

Learn about our business, the oil & gas industry, and our bond offerings through an engaging 1-hour presentation.

Register For A Bond Webinar

By registering, you agree to the privacy policy and consent to receive automated SMS messages and/or email marketing about investment or relevant offers by or on behalf of Phoenix Energy and/or trusted affiliated companies at the phone number and email provided. Consent is not a condition of purchase. Opt-out at anytime.

Production Status

Striving to be

the Best in the Bakken

At Phoenix Energy, we’re redefining operational excellence in the Williston Basin. With record-breaking milestones and cutting-edge innovations, we’re proud to lead the charge in American energy independence.

0 M+
0 M
Barrels Sold
Inception- 7/15/2025
0
Wells Drilled
As of 7/15/2025
0
Wells Planned
Over the next 12 months

Drilling Performance in North Dakota & Montana

Rockin’ in the Bakken

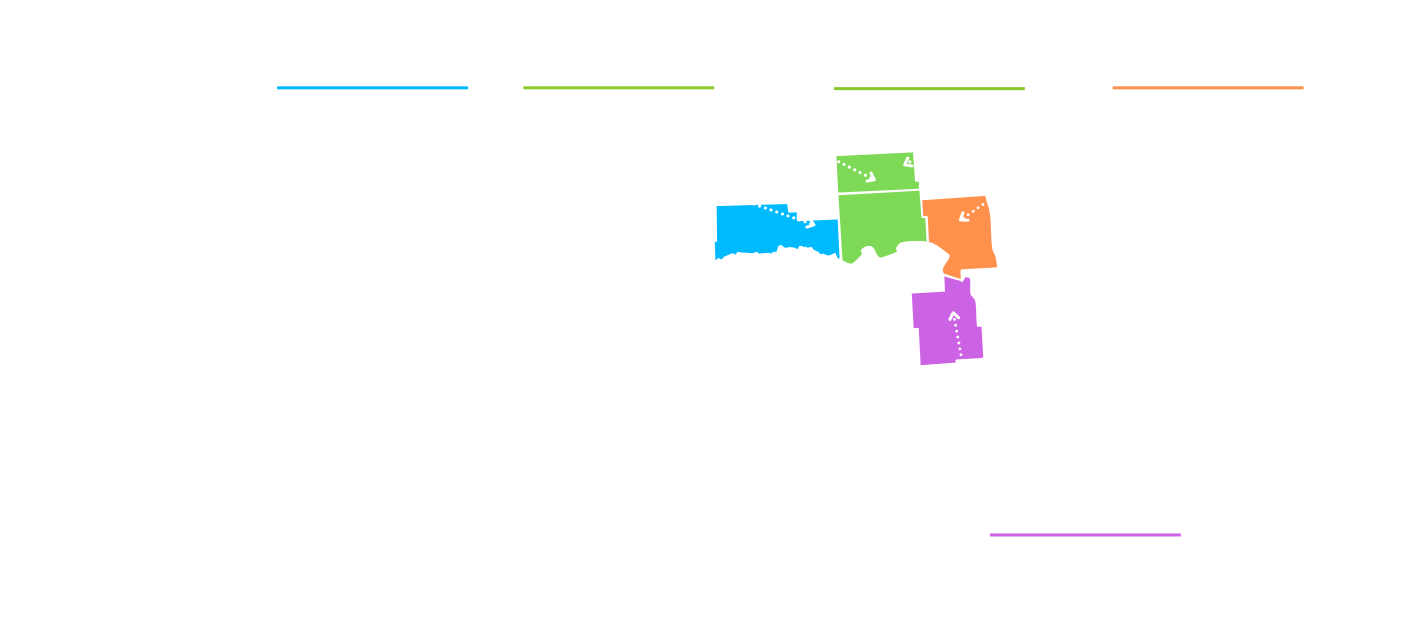
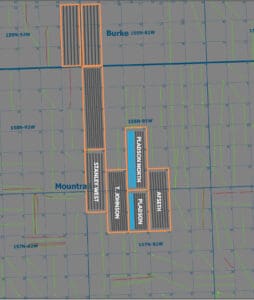
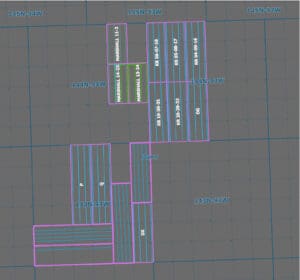
Stanley Map
STANLEY
Location Mountrail County
Calendar SPUD: Oct 2024
WELLS DRILLED:5
WELLS PLANNED:31
Updated May 2025
Alamo Map
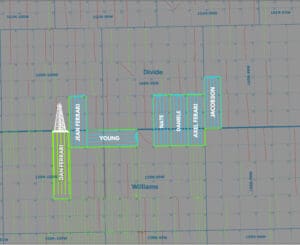
ALAMO
Location Williams/Divide County
Calendar SPUD: Feb 2025
WELLS DRILLED:31
WELLS PLANNED:48
Updated May 2025
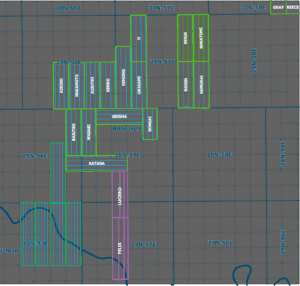
Knife River Map
KNIFE RIVER
Location Dunn County
Calendar SPUD: Dec 2024
WELLS DRILLED:12
WELLS PLANNED:16
Updated May 2025
Shogun Map
SHOGUN
Location Roosevelt County
Calendar SPUD: Nov 2024
WELLS DRILLED:8
WELLS PLANNED:60
Updated May 2025

Drilled

🏆 NYUSTEN (Alamo): 5 wells

Longest & Fastest 4-mile Well in the Bakken


GOPHER (Noonan): 5 wells

WILLER (Alamo): 6 wells

GOODNIGHT (Alamo): 5 wells

Completed

DANIEL FERRARI (Alamo): 5 wells

Producing

🏆 AXEL FERRARI (Alamo): 5 wells

Fastest 3-mile Well in the Bakken


JEAN FERRARI (Alamo): 5 wells

YOUNG (Alamo): 5 wells

NATE (Alamo): 5 wells

DANIELE (Alamo): 5 wells

JACOBSON (Alamo): 6 wells

SCADDEN SOUTH (Shogun): 1 well

PLADSON NORTH (Stanley): 3 wells

PLADSON SOUTH (Stanley): 2 wells

SAMURAI (Shogun): 4 wells

RONIN (Shogun): 4 wells

MARSHALL (Knife River): 12 wells

SHIVEY (Tioga): 5 wells

Leveling up & Leveling Out

Hedging Against Risk

11.5M¹

Total Qty of Barrels Hedged
As of 11/11/25

x

$61.07

AVG PRICE PER BARREL
As of 11/11/25

=

$700M

hedged production revenue

1. As of 11/11/25, these positions have been fully placed. The derivatives contracts are comprised of approximately 94% swap contracts and 6% put contracts. The hedged value is the product of the number of outstanding contracts and the weighted-average price of the swaps and puts. Additional details are available on the SEC’s website in Phoenix Energy’s Form 10-Q: Quarterly report for quarter ending Sep 30, 2025. Note: “Hedging against risk” refers to swaps and options contracts purchased in the derivatives markets based on Phoenix Energy’s projected reserve assets as of 11/11/25. This hedging strategy covers approximately 75% of the value of the producing assets over a three-year period. It is important to note that hedging does not directly mitigate investor risk.

Leveling up & Leveling Out

Hedging Against Risk

11.5M¹

Total Qty of Barrels Hedged
As of 11/11/25

x

$61.07

AVG PRICE PER BARREL
As of 11/11/25

=

$700M

hedged production revenue

Current & Projected Hedged BArrels (MILLIONS)¹

1. As of 11/11/25, these positions have been fully placed. The derivatives contracts are comprised of approximately 94% swap contracts and 6% put contracts. The hedged value is the product of the number of outstanding contracts and the weighted-average price of the swaps and puts. Additional details are available on the SEC’s website in Phoenix Energy’s Form 10-Q: Quarterly report for quarter ending Sep 30, 2025. Note: “Hedging against risk” refers to swaps and options contracts purchased in the derivatives markets based on Phoenix Energy’s projected reserve assets as of 11/11/25. This hedging strategy covers approximately 75% of the value of the producing assets over a three-year period. It is important to note that hedging does not directly mitigate investor risk.